- REVIEWS
Camera Reviews 
More Reviews Mobile Reviews Photography Reviews - GALLERIES
- VIDEOS
- BUYER'S GUIDES
Histograms in Levels: Diagnostic Tool and Quick Fix in One
All Photos © 2005, George Schaub, All Rights Reserved |
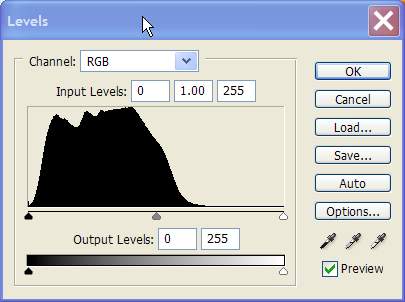
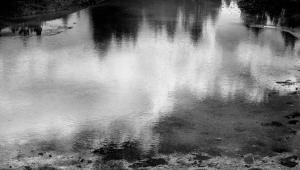
All the values are there but it lacks spark and the colors seem off. To diagnose the problem I opened the Levels control and here's the Histogram I saw.
Take a look at the Histogram. It shows that all the values are bunched up from medium gray to black, with no highlights at all. In fact, you could look at this Histogram without even looking at the picture and diagnose the problem.
 |
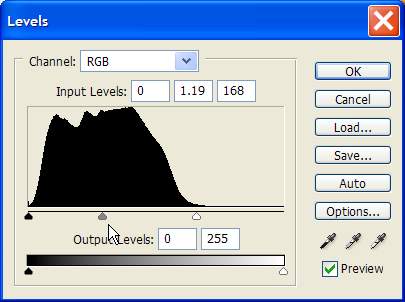
The next step is to "fill the gamut" by sliding the white point triangle (the one on the right) toward the center of the Histogram. It needn't go into the information; move it so that it just touches the start of the tonal information graph on the left.
Here's where to move it.
Note that when I moved over the white point it shoved over the middle gray point as well. This in effect redistributes the tonal values in the scene. Here's the result, to which I added a touch of color saturation later.
 |
Pretty amazing, no? It just goes to show you that you should not be discouraged by your results on screen before you have diagnosed the image with Levels and attempted a fix using the Histogram information.
Of course, not every image should be guided by just the Histogram alone. There will be times when the tonal values are not fully distributed and the shot still works. This comes into play with moody scenes, pictures with overall dark areas or when you're going for a high key (highlight dominated) effect.
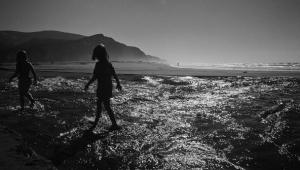
Here's a silhouette and its Histogram.
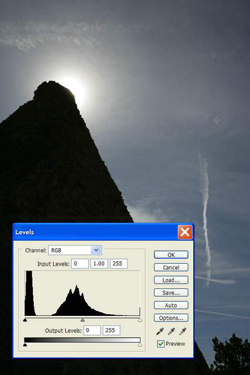 |
The dark values are all clumped together; there's clipping (loss) of the very dark values and there's a spike in the highlight area where the sun peaks over the edge of the formation. A funky Histogram, no doubt, but the picture is fine as is.
 |
||
|
||
So, use Levels and its Histogram and sliders as tools for making a quick fix
on "drab" images, but don't feel you have to follow it as
a rule--it's just a guide to getting the most tonal values out of
many scenes.


![]()
Get the Latest Photo Tips, News & Reviews from Shutterbug!
| Camera Reviews Other Reviews | Mobile Reviews Photography Reviews Columns | News | Features | How-To | Resources |
 © 2026 Shutterbug
AVTech Media Americas Inc., USA
All rights reserved