- REVIEWS
Camera Reviews 
More Reviews Mobile Reviews Photography Reviews - GALLERIES
- VIDEOS
- BUYER'S GUIDES
In The Darkroom
What Do Those H And D Curves Really Mean
I suppose a typical reaction to understanding H&D curves would be, "Who cares?" And, unless you're interested in learning how your film will perform under various circumstances, it might not be of any interest to you. But, I've always wanted to know how things were going to turn out beforehand! That way, there are no unpleasant surprises when it's too late to do anything about them. An H&D curve is a graphical way of representing how a given emulsion records tone values when developed under specific circumstances. When you change the developing--strength, time, temperature, agitation, etc.--the shape of the curve changes, indicating different things about how the tones have been recorded in the emulsion. All manufacturers publish H&D curves for their particular film representing at least the recommended development, and frequently how the film will perform when developed under several different circumstances. Of course, there is only one type of development that is ever recommended for color negative film: C-41. So, color negative film manufacturers never publish anything but the standard H&D curve. But, black and white films can be processed in many different brands of developer and for all sorts of different time and temperature combinations. Kodak's T-Max film and Ilford's Delta film are examples of film that are especially responsive to different brands of developer and to different time and temperature combinations. Both types of films are also responsive to different amounts of agitation that might be used during the development step. |
|||
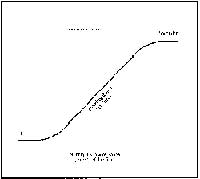
Both Kodak and Ilford publish several different H&D curves for these sensitive, responsive films. By studying the curves, you can quickly determine what combinations of developer, time, temperature, and agitation will produce the type of results that you are trying to achieve. The H&D curve is named after its inventors, a couple of British physicists named Hurter and Driffield. There! That wasn't so hard. Now, you know what H&D means. Now, look at Figure 1. The Real Scene is represented across the bottom of the graph. This is the scene that the camera sees. This is the lighting that the camera sees. For purposes of the graph, it is assumed that the lighting is very flat, allowing all the tones to be easily distinguished, one from another. For example, if you had a black colored dog sitting next to a white colored dog, you would be able to see all the little black hairs on the black dog, and all the little white hairs on the white dog. The black dog would represent the shadow tones in the Real Scene, and the white dog would represent the highlights in the Real Scene. OK, so far? Figure 1 shows what happens to those tones when captured onto film. In Figure 1, you can see that the low illumination level of light that is reflected back from the black dog strikes the H&D curve in the toe region, where it is recorded and graphically represented out to the left of the curve, as the Film's Emulsion. The higher level of illumination that is reflected back from the white dog is recorded up on the shoulder of the curve. Any midtones in the picture are recorded in between these two extremes. Now, here's where all of this gets a little tricky. I'll type slowly for those of you who are reading a little slower than normal about now. |
|||
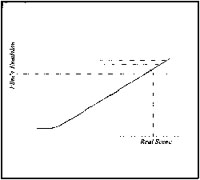
Notice that in Figure 1, the Real Scene tones are represented as being all equally spaced apart, meaning that they can all be equally distinguished, one from the other. And, in the Film's Emulsion, the midtones are still equally spaced apart, meaning that they can still be easily distinguished, one from the other. But, the shadow tones on the toe, and the highlight tones on the shoulder, have been compressed together due to the curving nature of the H&D curve. The straight portion of the H&D curve--out in the Working Range of the curve--maintained the nice, easy-to-see separation of the tone values in the midtones. But, in the shadows and in the highlights, once the tones started to be recorded on the curving portion of the H&D curve, they could no longer be kept equally spaced apart. The tones are compressed together in the toe and shoulder areas. When tone values get compressed together, there is no longer separation of tone values, which means that the shadows become one big black glob, and the highlights become one big washed out white glob! Look at Figure 2. It shows a common H&D curve. It also shows some of the names that we use to talk about different portions of the curve. The "toe" of the curve is the lower, curved portion. It is on this part of the curve that the shadow tones in the picture are charted. The upper curved portion of the curve is the "shoulder." It is where the highlights of the picture are charted. The midtones are charted in between. Notice that the "working range" of the curve is fairly flat. It is in the working range of the curve where the picture should be "placed" if an equal amount of detail is to be captured in both the highlights and the shadows. If you overexpose an image, you will be using the portion of the curve that is higher up toward the shoulder portion. If you underexpose an image, you will be using the portion of the curve that is lower down near the toe of the curve. Study Figure 3 to better understand this. The normal exposure range of the curve is the range that is used when you use the manufacturer's recommended ISO and development. |
|||
Now, look at Figure 3. If you were to intentionally underexpose a picture, you would be moving the Exposure Range down on the H&D curve, where the highlights would be recorded on the lower, straight portion of the curve. An underexposed picture would not wash out the highlights. But, what would happen to the shadow tones in an underexposed picture? Look again at Figure 3. In an underexposed image, the shadow tones would be forced down onto the toe of the curve, where they would be definitely compressed. The shadows would become one big black glob. This is exactly what happens when you shoot slide film and underexpose it. You get great highlights, in which you can see all the rich detail. But, the shadows turn into a solid black glob with little, if any, detail being visible. Figure 3 also shows what happens with slide film when you overexpose the picture. The Exposure Range moves up the H&D curve--where the shadows are nicely recorded in all their detail. But, the highlights have now been forced up onto the shoulder where the curving shape of the H&D curve compresses the highlights into one big white washed out glob. All of the H&D curves that are shown in the Figures are curves for negative films. When curves are drawn to represent positive (slide) films, they flip over, with the toe of the curve being in the lower right of the graph and the shoulder being in the upper left of the graph. All the principles remain the same, however. |
|||
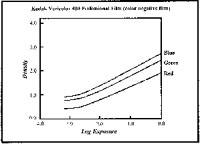
The angles of the curves that are shown in the Figures are all about 30-45. That's about average for continuous tone films, like camera film. When the curve starts to become steeper, and is almost straight up and down, it is representing a special, high contrast film like a lithographic film that records images in only two tones--solid black and solid white. Therefore, you should remember that the steeper the angle of the curve, the higher the contrast that will be recorded in the emulsion. With color films there's not much you can do to manipulate the angle of the curve. Oh, yes, you can over- or underdevelop the film, but we all know that when you do those things with color films you're toying with disaster. With color films, you should never attempt to over- or underdevelop unless you are trying to compensate for an opposite condition of exposure, and then, only within a limited range. Now, look at Figure 4. Here I've drawn the H&D curve as a straight line. It has a toe, but it really doesn't have a shoulder. The upper portion of the curve just goes straight right off the graph. Notice what has happened to the highlight tones in this straight, no-shoulder curve. Since there is no curved portion of the H&D curve to distort them and compress them together, they remain nicely separated. Under these conditions, you would be able to easily see all the delicate detail in a white wedding dress--the highlights. The wedding dress would not turn into a white glob. But with black and white films, you can always over- or underdevelop as a technique for moving the H&D curve around in an effort to change the performance of the emulsion. Remember the old black and white saw about "expose for the shadows and develop for the highlights"? Well, that's another way of telling you to develop the film until the shape of the curve will just barely produce detail in the highlights. If you continue to develop the film after the highlight detail has been brought up to the "adequate" level you will be overdeveloping them, resulting in a negative where the highlights are so dense that they reproduce as a big white glob. Of course, if you stop the film's development when the highlight detail is just barely adequate, you'd better be sure that you have adequately exposed it or you won't have any shadow detail at all. Remember, "expose for the shadows." In effect, that adage means to use more exposure than the official ISO of the film would call for, and probably less development. That adage was coined back in the days when many black and white films were naturally very high in contrast and it was a constant battle to hold the contrast down to a level where the image would print nicely. If you have ever had the opportunity to make prints from some really old black and white negatives or glass plates, you know how superhigh in contrast these old negatives are, and why photographers were told to expose for the shadows and develop for the highlights. This simply was a technique to help hold down the runaway contrast levels. Today things are a lot different. Modern black and white films perform very nicely for general purpose work if you simply do what the manufacturer recommends. Use the recommended ISO level for exposure and the recommended brand of developer at the recommended time and temperature. Those recommendations will produce a nice average range of tone values from real scenes having typical, average lighting levels. But, when things are not so average, or when you want to alter reality for artistic purposes, then you can study the manufacturer's published H&D curves to determine how to create the effect that you want. All black and white films respond to variations in development conditions. But, some films, like Kodak's T-Max and Ilford's Delta, respond with even greater degrees of change when processing conditions are altered. That's why it's so important for you to clearly understand what you're doing when you work with these high tech films. Everyone knows that you dare not over- or underexpose color slide film because you will lose detail in either the highlights or the shadows. As I have explained earlier, that is because all positive color film has a very clearly defined toe and shoulder to their H&D curve. But, the H&D curve for color negative film is considerably different in shape. Figure 5 is a reproduction of the official published H&D curve for Kodak's old Vericolor 400 Professional film. Curves for any of the newer, modern, films will be almost identical. Since there are three (cyan, magenta, and yellow) dye layers in color films, the H&D curve for a color film consists of three curves, one for each dye layer. Don't let the three curves bother you. Just look at their angle and shape. Notice that there is no shoulder for the H&D curve for Vericolor 400 film. The lines just go straight off the graph! That means that you can intentionally overexpose it without the highlights being compressed into a big white glob. Remember what happens to the shadow tones when you intentionally overexpose a film? That's right. As the Exposure Range is moved up the H&D curve, the shadow tones become uncompressed, allowing you to see a greater amount of detail in the shadows because you have created greater "separation" (of tone values). So, since there is no penalty (no compression of highlights) for overexposing most color negative films, and since you get much better shadow tones when you do, why not do it? Most knowledgeable photographers do overexpose their color negative films. Especially when they are photographing dark, low reflective subject matter, where they might otherwise lose detail. Now that you understand how H&D curves work for conventional film, it might be a little easier to understand the Curves tool in Photoshop that digital photographers use to make adjustments in density, contrast, and color balance. I don't have room in this article to go into the use of the Curve tool, but I wanted you to know that it's patterned after regular H&D curves used in conventional darkroom work. |


![]()
Get the Latest Photo Tips, News & Reviews from Shutterbug!
| Camera Reviews Other Reviews | Mobile Reviews Photography Reviews Columns | News | Features | How-To | Resources |
 © 2026 Shutterbug
AVTech Media Americas Inc., USA
All rights reserved