- REVIEWS
Camera Reviews 
More Reviews Mobile Reviews Photography Reviews - GALLERIES
- VIDEOS
- BUYER'S GUIDES
Instant Exposure Check
How And Why To Use Your Histogram
One of the main benefits of using a digital camera is being able to evaluate an image right after exposure in the LCD on the back. However, being so small, most LCDs are not as critical as you might like for checking sharpness or even expressions. Some allow you to zoom in, making them more useful in that regard. For me, the main advantage of the LCD is checking the exposure. Just as with film photography, correct exposure is key to quality images. In some ways, overexposure is more problematic in digital, as the sensor tends to clip data above a certain threshold. Overexpose can result in lost highlight detail and tonal texture, and while there are ways to remedy this most corrections are at best difficult to obtain. But there is hope for exposure problems if you catch them using the histogram, a graphic representation of the gray scale values from 0 (black) to 255 (white).
"Expose To The Right" Rule
Is there an ideal histogram? It depends on the image contents and how the values
are distributed, but in general the optimum histogram display would:
1) Not indicate any overexposure or lost highlight values.
2) Not indicate too much underexposure, as you may lose shadow details but more
importantly get
more noise.
In theory, the "perfect" digital exposure, as far as a histogram
read-out is concerned, is as far to the right as possible where there is no
chance of overexposure. In practice, obtaining this is not that easy. The overall
shape of the histogram does not matter, as it merely reflects the tonal distribution
of the scene you photographed. Nevertheless, slight underexpose is recommended
to eliminate the risk any highlight clipping, something those who have mastered
slide film photography will recognize and appreciate.
Color Channel Clipping
While most histograms in cameras show the histogram as gray scale levels we
are dealing with color images, so we really have histograms of all three RGB
channels. Some clipping can occur in the one or two color channels, a condition
that might not be shown in the typical luminance histogram.
Here are four histogram examples (created in Photoshop) that show different image characteristics and the histogram basics:

Histogram 1: Histogram indicating strong overexposure.
The highlights (right side of the histogram) have just been lost. This would
be a candidate for deletion in all but a few very rare cases. Some might recommend
to "burn" the photo in Photoshop. This is "faking" details
in the highlights that are not there.
Histogram 2: Histogram indicating potential overexposure.
Here there's only a small spike in the highlights and it very much depends
on the photo whether this might be a problem or not. If the spike represents
a real pure white or an unimportant spectacular highlight then this photo may
be OK. Otherwise, you are in trouble.
In these cases, if the camera has the ability to indicate overexposed areas,
I would recommend viewing the camera's LCD preview with the highlight/overexposure
indicator enabled.
Histogram 3: Histogram indicates good exposure.
Here the highlights are OK. You lose a bit of the dynamic range in the highlight
area but Photoshop can correct for this. You should endeavor to get histograms
like this. In principle, it is best to get as close as possible to the right.

Histogram 4: Histogram indicates strong underexposure.
Here the data in the shadows is lost. This is not the only problem because digital
cameras show much more noise in the shadows. Even when the image is corrected
extended noise might show up in the mid range.
 |
|
|
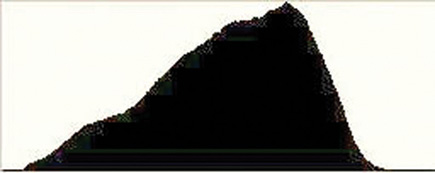
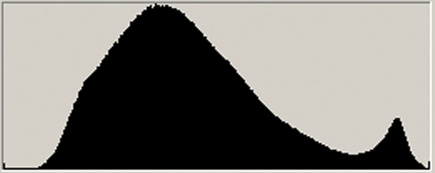
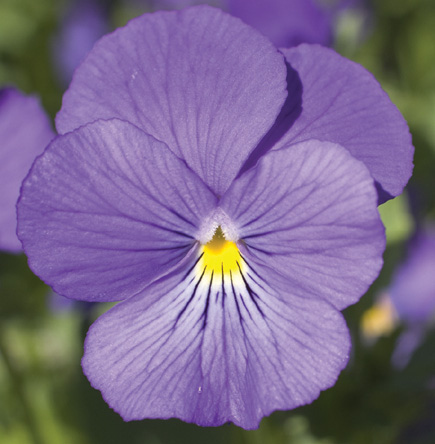
Look at the example from the Canon EOS 10D (#1 above) that demonstrates a typical problem with saturated colors (#1). The histogram in Camera Raw 2.2 shows the challenge in the blue channel (#2 below).
 |
|
|
|
| |||||||||


![]()
Get the Latest Photo Tips, News & Reviews from Shutterbug!
| Camera Reviews Other Reviews | Mobile Reviews Photography Reviews Columns | News | Features | How-To | Resources |
 © 2026 Shutterbug
AVTech Media Americas Inc., USA
All rights reserved