- REVIEWS
Camera Reviews 
More Reviews Mobile Reviews Photography Reviews - GALLERIES
- VIDEOS
- BUYER'S GUIDES
Perfect Exposure
Perfect Exposure
The Histogram Is Your Best Friend
by Steve Bedell
There are three things that constitute a “perfect” digital file. Perfect exposure, accurate white balance, and a controlled brightness range. In this article, we’re going to focus on the first—perfect exposure. And in the process, we’re going to spend a lot of time giving you a much better understanding of just what those spiky graphs on the back of your camera mean.
First, let’s get a definition of what a histogram is. I’ve seen it described in many ways but I think the best way to describe it is this: A histogram is a graphical interpretation of the brightness values in the photo. If you think about that for a minute, unless you spend your days taking photos of Kodak Gray Cards, each histogram will look different. There is no such thing as a “‘perfect” histogram. There seems to be some misconception out there that a good histogram will look something like a hill, with little information on each end and plenty of information in the middle. Nonsense. If you photograph a black cat on a dark background, the only information will be on the left (darker values) side of the histogram. Take a photo of snow, and the opposite will be true.
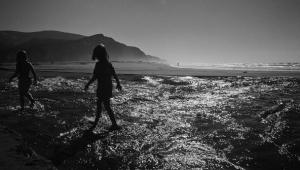
Let’s look at those values and what they stand for. The accepted wisdom is that current digital cameras can capture about a five stop dynamic range. We’ll have to touch on brightness range here briefly for a full understanding of the histogram. That means that if the difference between the darkest and brightest value in the scene is five stops or less, you should be able to have detail from the darkest shadow to the brightest highlight—if you’ve exposed it properly. If the scene that presents itself is greater than five stops, such as a strongly backlit situation, then some areas of the scene will not have detail and it will show on the histogram as a line shoved up against the left or right side. How much and what sections of the photo are without detail will be determined by your exposure. If it’s a static scene, multiple exposures can be taken at different values and then merged together, but that is beyond the scope or intent of this article.
What about the philosophy that as long as it’s close, we can fix it later in Photoshop? That’s not a very good idea. Whether you shoot raw or JPEG, proper exposure is the foundation of an excellent file. Even though we have many tools at our disposal to help “correct” our mistakes, it is much easier and less time consuming to just get it right in the first place. A thorough understanding of exposure and the role the histogram plays in supplying us with valuable information is the first step in creating high quality files.
Histograms Explained
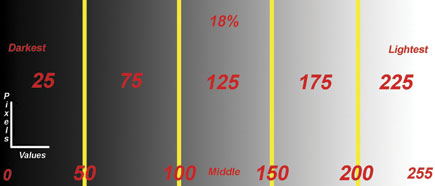
Let’s take a look at the values a histogram will show us. There are 256 discrete levels of brightness. The left edge starts at zero and represents total black. The far right ends at 255 and is total white. Anything left of zero will be black devoid of detail. Anything right of 255 will be burned out highlights with no detail. In practice, it’s a good idea to give yourself a little breathing room and not allow any values that you want to have detail to be between 10 and 245—about 10 points on each side.
 |
|
 |
|
|
I made a little “L” graph on the left side of the histogram. The horizontal axis shows you the values as described above. The vertical axis is about volume. The more pixels in a given value, the higher the spike.
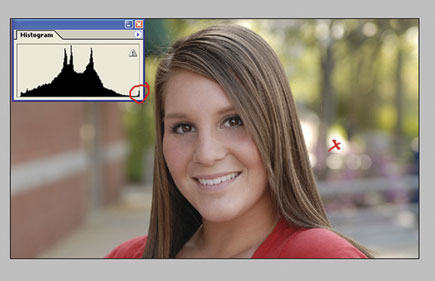
The photo of model Heather Fournier shows lots of information in the center of the histogram and less towards the edges. You can see by looking at the photo that that’s just how it should be. I marked in red the very small area you can see on the right side of the histogram that represents the overexposed highlights, also marked in red on the image. You would not adjust your exposure because of these. If you found them objectionable, you could change camera position, move the model, or clone them out.
Using the histogram in conjunction with your camera meter should allow you to get perfectly exposed images very easily once you understand just what’s happening. Use your preferred in-camera metering method—spot, center-weighted, matrix, or even a hand held meter. Take a look at the image and the histogram together. Do they match? By that I mean do the values in the scene coincide with the values in the histogram? Lots of dark areas will give you a histogram weighted to the left and the opposite is true. A scene with a wide variety of values should give you values throughout the histogram. If you see room for improvement, just use you cameras plus or minus exposure compensation controls until the values fall where they should be.
A Tale Of Three Histograms
All this talk about values and where they go may make a lot more sense to you once you see the histogram and the photo together. So let’s look at three different photos and their histograms so you can really visualize what we’ve been talking about.
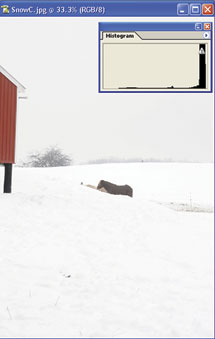
1. White Snow
I’ve included the horse and building on the side as a reference but you can see when you have a scene where most of the values are white, then a proper exposure will show a histogram with most of the information on the right side. The highest value I can find in the image using the info tool in Photoshop is 245, which will allow me to have detail even in the brightest highlights.
 |
|
|
2. Studio Portrait
Look at the studio portrait of Dan Kleinmann. He’s got dark clothing against a dark background. The only light areas are his face and hair. So most of the values are very low, as represented by the histogram. Note that even though the values are crowded up against the left side, the lowest number I could find using the info tool in Photoshop is about 15. That is why the values are close to, but do not touch the left side. There is still some detail in the darkest values.
 |
|
|
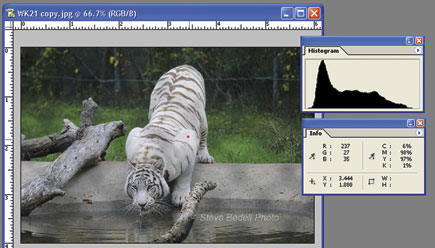
3. White Tiger
This photo was taken using aperture priority and matrix metering with no compensation. Since there are dark, light, and middle tones in the image, we have a histogram that shows a wide range of values throughout the image. I marked in red the area that the info tool is showing.
 |
|
|
- Log in or register to post comments


![]()
Get the Latest Photo Tips, News & Reviews from Shutterbug!
| Camera Reviews Other Reviews | Mobile Reviews Photography Reviews Columns | News | Features | How-To | Resources |
 © 2024 Shutterbug
AVTech Media Americas Inc., USA
All rights reserved