- REVIEWS
Camera Reviews 
More Reviews Mobile Reviews Photography Reviews - GALLERIES
- VIDEOS
- BUYER'S GUIDES
X-Rite i1Photo Pro: A Complete Solution For Display And Print
There are few things in digital photography more frustrating than problems with color fidelity. One of the most commonly heard complaints is “my prints don’t match my display.” While color accuracy is improved with LCD displays, it isn’t perfect by any means, and if you’re serious about your photography it’s important to calibrate your monitor. And, if you do your own printing, you’ll often find that you can improve the quality of your prints with profiles built specifically for your printer and paper selection.
One of the vendors that pro photographers and serious amateurs alike have used for years is X-Rite. With both display-only products (the i1Display 2), and complete display and print packages like the i1Photo Pro, it’s possible to take complete control over the color process in your workflow. In this review, I’ll be taking a look at the latest version from X-Rite, the i1Photo Pro package. With the ability to measure and calibrate displays, printers, projectors, cameras, and perform spot color measurements with PANTONE color matching, it’s hard to imagine needing a more full-featured set of tools.
Hardware calibration tools fall into two main categories—spectrophotometers and colorimeters. Both are very capable, and certainly provide better and more consistent results than non-hardware calibration can provide. Spectrophotometers, such as the one used by X-Rite, scan a wider range of light values and are able to read both reflective (paper) and emissive (displays) sources. A colorimeter, on the other hand, uses filters to read red, green, and blue light values with a smaller set of colors, and is designed for emissive sources of light. The colorimeter has an advantage in reading dark tones with improved shadow detail over what a spectrophotometer can read.
Along with the different capabilities, the cost difference is large. While you can get a very capable colorimeter, such as the i1Display 2 or the Datacolor Spyder3 for around $200, a spectrophotometer will start at about $500 (the X-Rite ColorMunki) and go up from there.
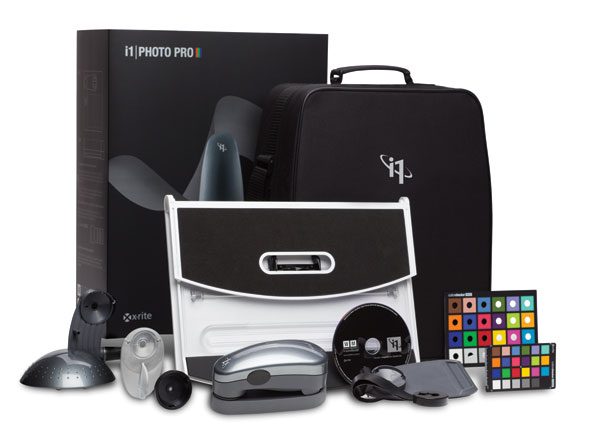
What’s In The Box
The i1Photo Pro includes the i1Pro spectrophotometer for actually measuring color, and a completely new set of software that is both easier to use than the previous version as well as offering new features for the more advanced user when they are ready for them.
The new software, i1Profiler, combines elements of i1Match, the previous monitor and printer calibration application, along with ProfileMaker, the more advanced and complete profiling package for creating and manipulating profiles, including tuning them for different light sources. Like many programs today, i1Profiler uses a wizard-based interface to help reduce the learning curve, and when you’re ready for the advanced features, you can go to the menu-based user interface that gives you total control over the profiling process.
Also included in the software bundle is the ColorChecker Passport camera calibration program. When used with the supplied ColorChecker Classic mini target, you can build camera profiles for Adobe Lightroom and Photoshop.
Profiling With i1Photo Pro
All profiling is done through the new i1Profiler application, #1. On the start-up screen, you’ll select the type of profile you want to create, and whether to use the Basic or Advanced mode, #2.


You have three options to select from in Basic mode—Display, Projector, and Printer profiling. All have preset options to make the calibration and profile creation as simple as possible. In the Display mode, you select from white point options and luminance settings. You do have the option to use ambient light measurements to assist with the luminance if you decide to vary from the typical 120 setting, #3.

Once the calibration process is completed, you’ll see a results screen with three options to examine the new profile—a chart view, #4; linear change, #5; and a screen with different images that can be seen in before/after views, #6.


Once you move over to the Advanced mode, the number of options available to you increases greatly. For displays, in addition to the white point and luminance options, you can set the contrast ratio for your display, and work with profiling workflows that let you save settings for future use, very handy when you have multiple displays to profile.
Another option in Advanced mode is a QA check on your monitor and profile. In this mode the display is remeasured, #7, and compared to the original profile to see how much, if any, change has been made. The screen shows the DeltaE variances for different colors with a pass or fail rating, #8. It’s a great way to see if your display is maintaining color accuracy, or if you need to start planning for a new display.


For printing, #9, you can select the printer you’re profiling, the paper size you want to print the chart to, and the chart size—small (400 samples), medium (800 samples), or large (1555 samples). A larger sample size will obviously take longer to print and scan, but the benefit is an increase in color fidelity and improved shadow and highlight details.

In Advanced mode, the number of options grows dramatically with more chart options and, like the Display mode, workflow options that can be saved for future use, #10.

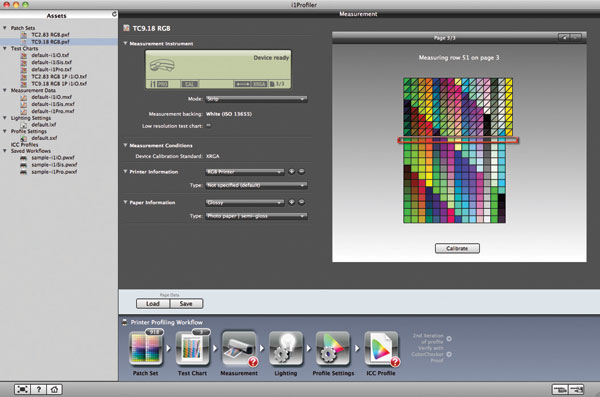
To actually create a printer profile, you’ll print out test charts from within i1Profiler (be sure to turn off color management in the printer driver), and use the included sled to scan each row of your charts, #11. I scanned a standard 918-patch chart in about five minutes. The software gives you feedback as you go along, making it difficult to lose your place and scan the wrong row, #12.

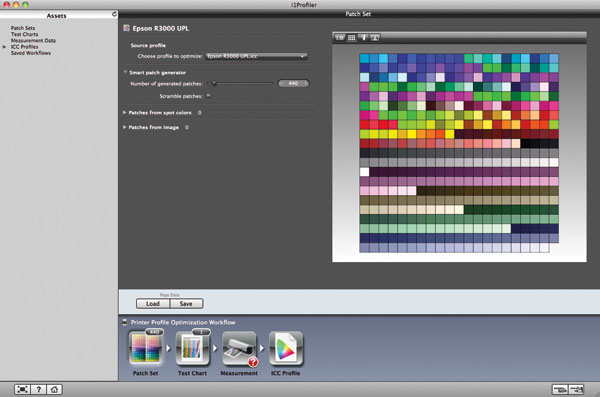
One feature I found very useful was the ability to optimize a profile, #13. You can select the number of patches to reprint and measure, with the data being applied to the current profile to increase accuracy. Although the difference was very slight, I did see an improvement in black-and-white prints in both highlights and shadows, and more importantly, neutrality of gray tones.
You can also print out a ColorChecker chart for use with the included reference chart. This chart has holes that correspond to the print you create, #14, making a direct comparison to the reference color and the print color very easy and accurate, #15.


Although I did not test the included ColorChecker Passport for this review, it is the same software as previously covered that lets you build custom camera profiles for Adobe Lightroom and Adobe Camera Raw.
Wrapping Up
While not inexpensive at $1399, the i1Photo Pro package is a complete solution for both display and print needs. If you don’t feel the need to create printer profiles, you can get excellent results with the i1Display 2, or if your needs are less, the ColorMunki at a fraction of the price will work well for you. But, for the serious pro with a variety of needs, including creating profiles for different light sources, and projectors, this is an excellent value that should be strongly considered.
For more information, contact X-Rite at: www.xrite.com.


![]()
Get the Latest Photo Tips, News & Reviews from Shutterbug!
| Camera Reviews Other Reviews | Mobile Reviews Photography Reviews Columns | News | Features | How-To | Resources |
 © 2026 Shutterbug
AVTech Media Americas Inc., USA
All rights reserved